Freelance
Energy Analysis
Created data-driven platform for analyzing peak and off-peak energy consumption with dynamic visualization, integrated SOLR analytics, and subscription system.
Project Overview
Energy Analysis is a platform for analyzing energy consumption patterns. Users can upload Excel sheets containing quarter-hourly energy usage data and generate detailed analytical reports.
Created a data-driven platform for analyzing peak and off-peak energy consumption with dynamic visualization.
Implemented system for users to upload Excel sheets containing quarter-hourly energy usage data.
Integrated SOLR analytics for extensive data querying and performance tracking.
Built subscription system with bank transactions and PayPal integration for premium features.
Key Features
Quarter-Hourly Energy Analysis
Users can upload Excel files containing energy consumption data, which is analyzed for peak and off-peak trends.
Dynamic Charts with Export Functionality
Provides interactive charts with options to download and share analytical reports.
Peak vs. Off-Peak Cost Calculation
Automatically calculates energy costs based on peak and off-peak usage.
Subscription System
Users can purchase plans via bank transactions or PayPal for premium analytics features.
Two-Factor Authentication & Magic Link Recovery
Ensures secure account creation and password recovery using email-based authentication.
Challenges & Solutions
Handling Large Energy Datasets
Quarter-hourly data over long periods resulted in performance issues during analysis.
Solution
Implemented data indexing and SOLR analytics for efficient query performance.
Accurate Peak and Off-Peak Calculations
Ensuring correct time-based classification of energy usage based on regional peak hours.
Solution
Developed a configurable time-based classification system to adjust peak hour calculations dynamically.
Secure Payment Integrations
Managing both bank transactions and PayPal subscriptions securely.
Solution
Integrated encrypted API calls and robust verification mechanisms for transaction security.
Project Gallery

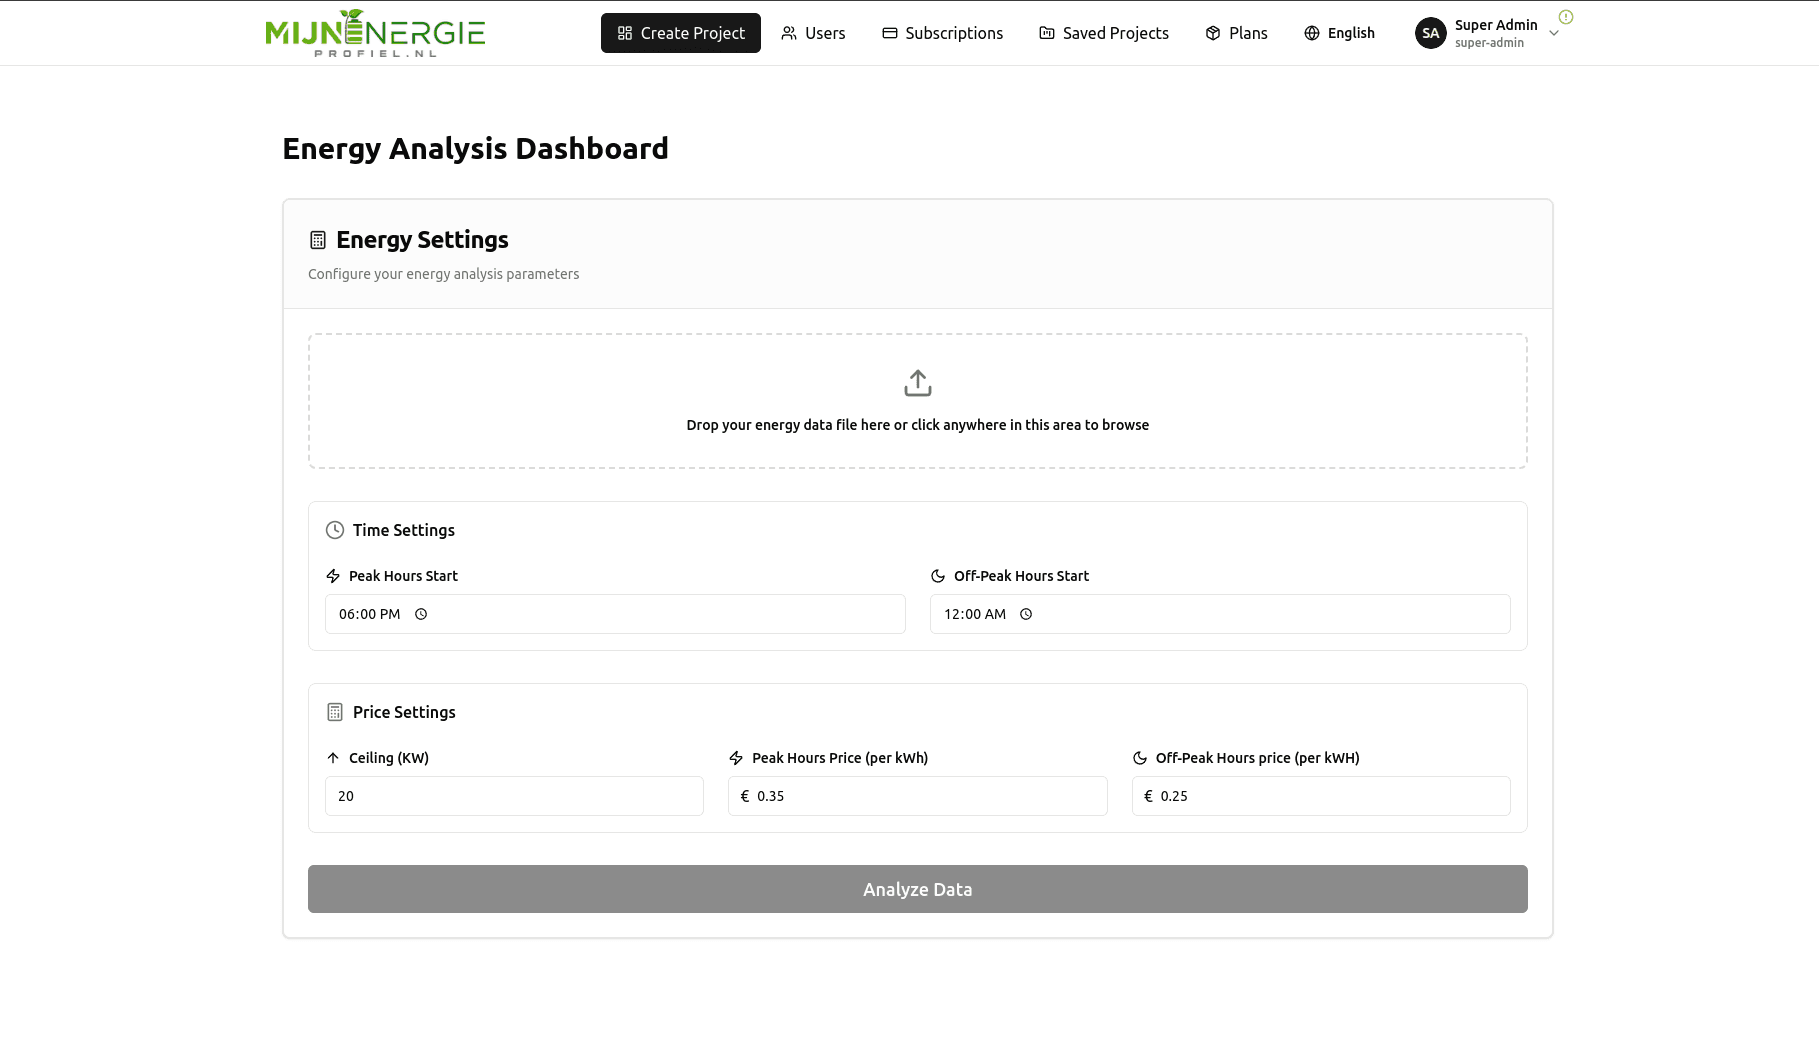
Energy consumption analysis dashboard.

Dynamic chart displaying peak vs. off-peak usage trends.
Project Details
Timeline
Aug 2024 - Present
Company
Freelance
My Role
Full Stack Developer
Tech Stack
Links
Visit Live SiteTestimonial
Energy Analysis transformed the way we monitor and optimize our energy costs. The peak vs. off-peak analysis is a game-changer.

Daniel Carter
Energy Consultant